How does Trading Edge Dynamics® work?
Trading Edge Dynamics® is a tool that performs automated Technical Analysis (TA) on historical stock data and is suitable for all levels of trader from novice to advanced users.
The simplified and automated TA tool can help you identify trend direction and possible trend changes which can assist you in preserving your capital.
The platform provides you with a choice of three Technical Analysis (TA) strategies – Short, Long and Flex term, which you can apply to suit your own investing or trading style.
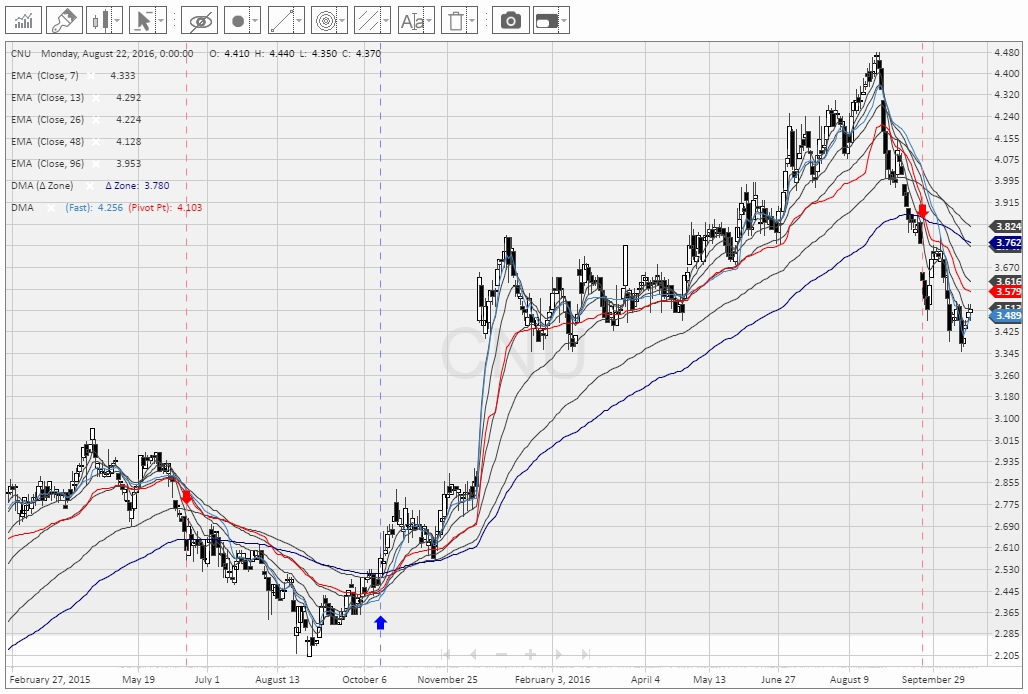
Based on your strategy, the platform identifies bull and bear trends and flags the dynamic Δ Zone signalling the change in trend. It uses a complex and proprietary formula to combine 10 technical indicators to provide easy to follow trend change Alerts without the time consuming chart interpretation needed for the usual forms of trend analysis.
How do I use the platform?
Trading Edge Dynamics® is an extremely effective yet very simple tool to use. To get started simply:
 Choose a technical analysis strategy to suit your investing or trading style and Alert frequency
- Select your stocks and put them into your choice of Watchlist (you can have up to 10 Watchlists)
- Check for new Alerts on the daily updated Alert summary or receive our daily email report
The system will calculate and provide BULL and BEAR Alerts for all stocks in your Watchlists. These Alerts can be used as guides to identifying trend direction or you can just follow the dynamic trailing alert values to look out for the next potential change in the trend.
What doesn’t the platform do?
 Trading Edge Dynamics® is a tool and NOT a trading system and user judgement is always required. In fact, we recommend that you identify stocks with sound fundamentals to analyse when you set up your watchlists.
We also encourage you to monitor other factors influencing stock price movements such as reporting results and dates, price sensitive announcements and ex-dividend dates.
What is the technical analysis behind the Alerts?
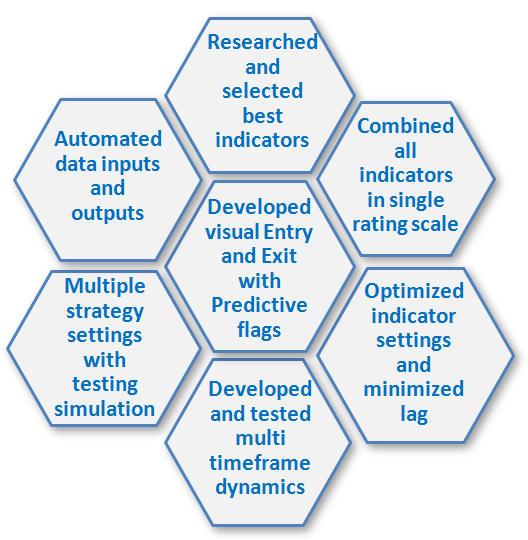
Trading Edge Dynamics® uses a complex and proprietary formula to combine 10 technical indicators to provide easy to follow trend change Alerts.
 The traditional use of any single indicator can provide some insight to a trend, but as all indicators rely on past data, indicators can only tell us what has already occurred with a lagging response.
A key feature is the use of dynamic filters to accelerate or decelerate movement in the direction of the trend. This accelerated responsiveness is used to compensate for lag whilst the combination of the indicators strengthens the reliability of the signal.
The technical analysis indicators used in the formula include:
- Chaikin Oscillator (CHA)
- Dynamic Moving Average (DMA)
- Directional Movement Index (DMI)
- Exponential Moving Average (EMA)
- Index Price Ratio (IPR)
- Moving Average Convergence Divergence (MACD)
- Momentum Index (MI)
- Relative Strength Index (RSI)
- Parabolic SAR (PSAR)
- Stochastic Oscillator (STO)